An ROC curve is a plot of sensitivity on the y axis against (1−specificity) on the x axis for varying values of the threshold t. The 45° diagonal line connecting (0,0) to (1,1) is the ROC curve corresponding to random chance.


An ROC curve is a plot of sensitivity on the y axis against (1−specificity) on the x axis for varying values of the threshold t. The 45° diagonal line connecting (0,0) to (1,1) is the ROC curve corresponding to random chance.
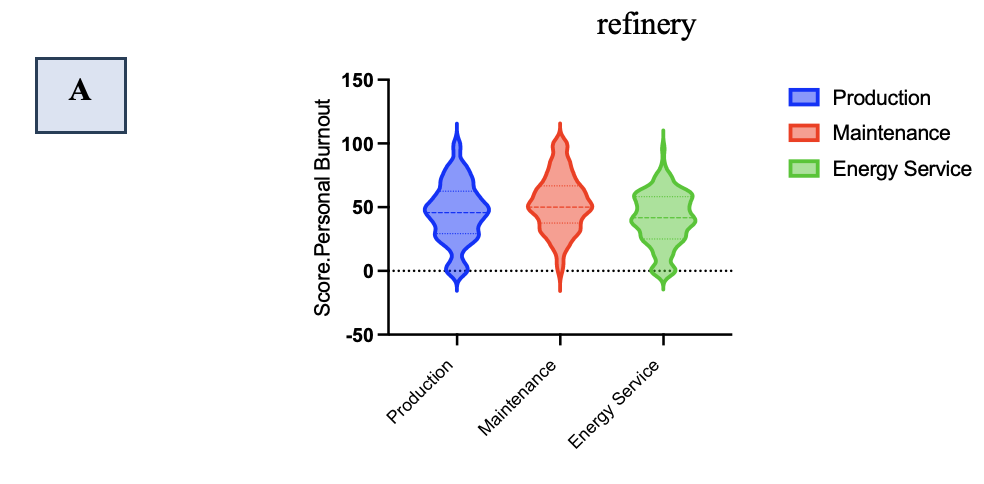
Violin plots are used to visualize the distribution of a single continuous variable. The plot displays the density estimation...